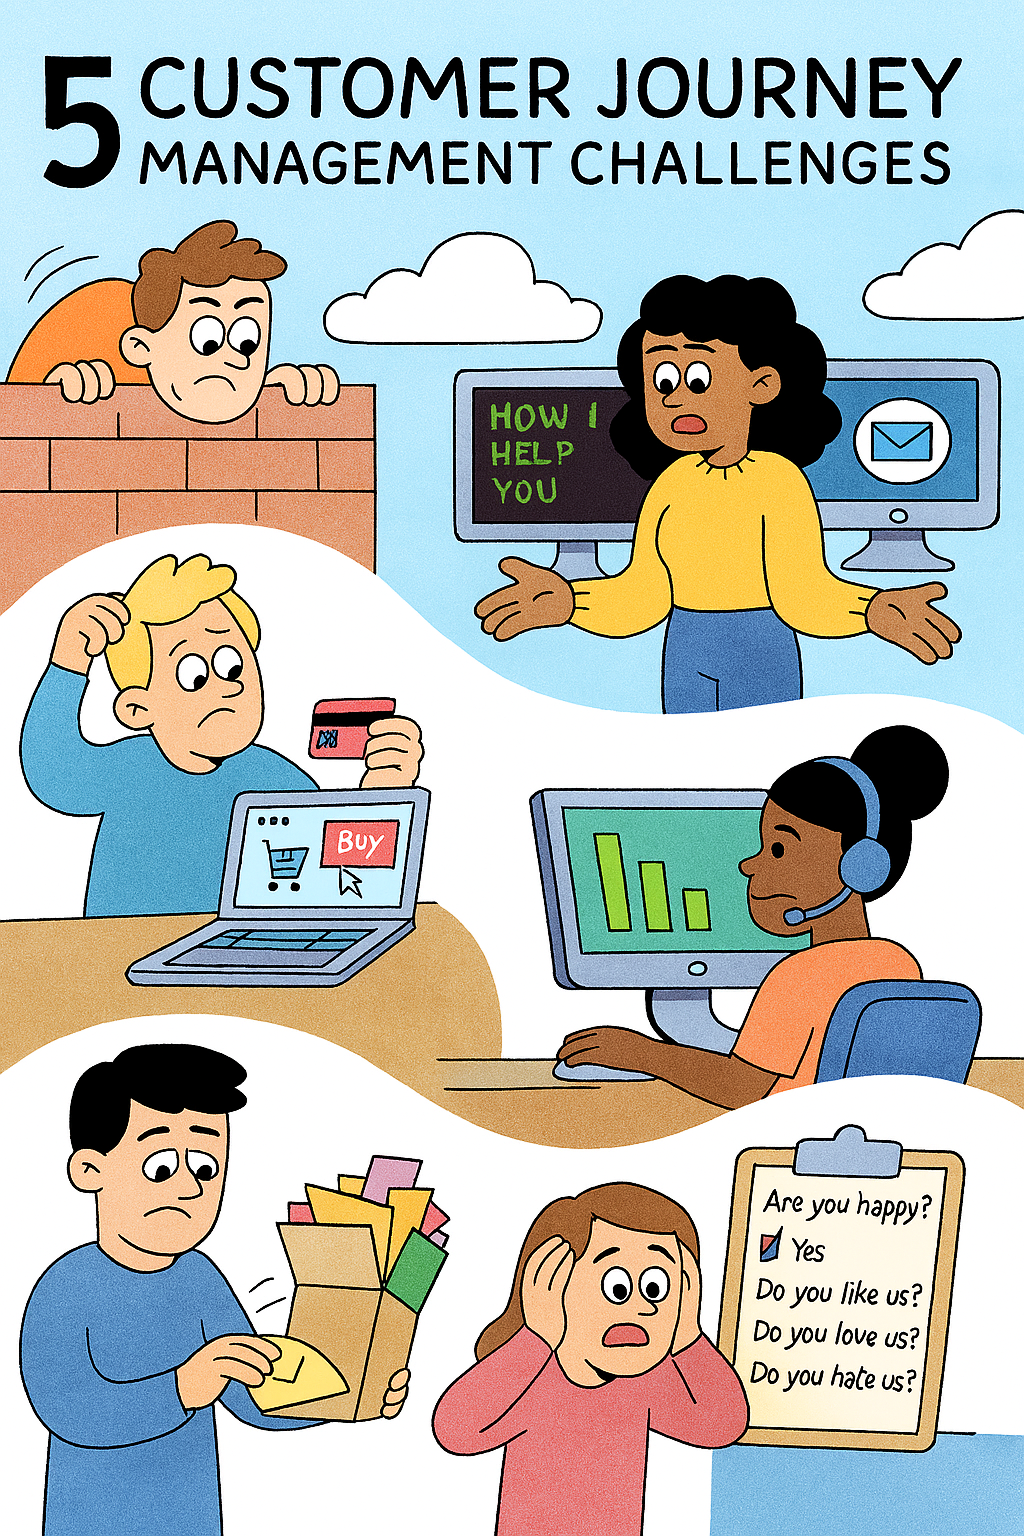
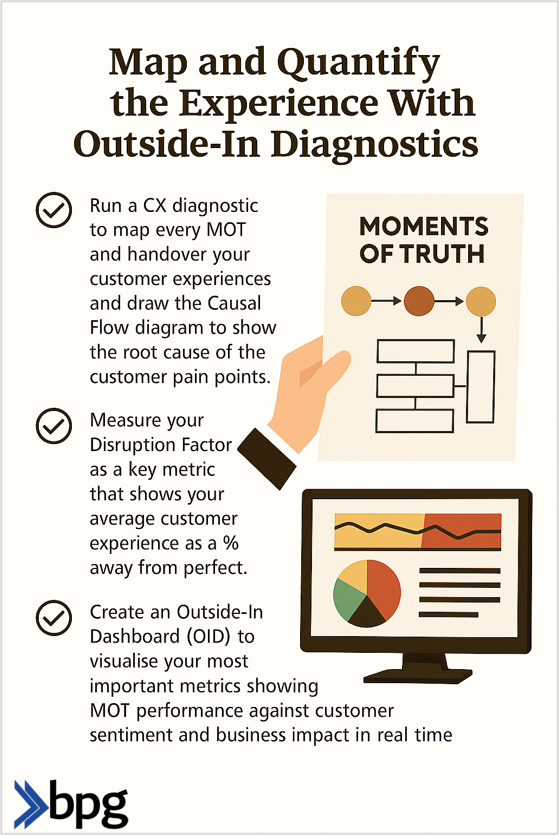
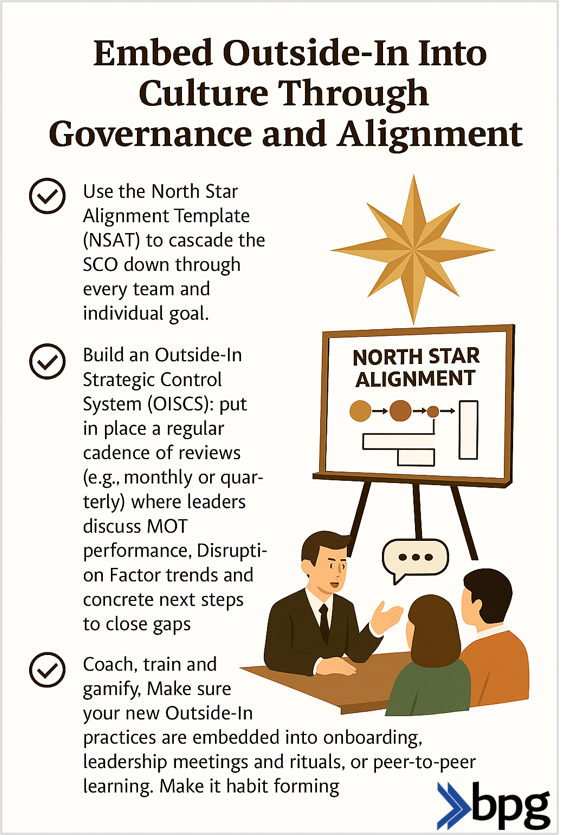
There are five central customer journey management challenges, and these include a lack of customer data and insights, siloed and/or inconsistent touchpoints, poor personalisation, friction in navigation and/or processes and weak measurement of outcomes.
In this post, I will explain the five customer journey management issues in detail.
1. Lack of customer data & insights
✅ How should we approach this challenge?
Take a look at customer intelligence platforms that offer analytics capabilities
These days many businesses have customer data or records about how their customers are interacting with them.
But fewer are using the data to make it usable & put it to practical use by acting on customer insights.
This causes a major problem, which is when organisations lack knowledge about their customers, the journeys they build tend to be ‘spray and pray’ & impersonal.
Solution: Customer analytics is a solution for this, it will allow you to gather insights from the data you have on your customers.
Predictive analytics also can be leveraged to further give you customer needs prediction insights, understand trends and/or recommend actions for the future.
2. Siloed & inconsistent touchpoints
✅ How should we approach this challenge?
Focus on the 15-20% of actions & interactions that matter most (80/20 rule) and break down functional silos
In a perfect world, it wouldn’t matter which channel a customer chooses to engage with a brand; their experience should be seamless & consistent across the board.
In the real world, however, there are often functional or departmental silos where messaging, tone of voice, and/or customer experience quality can change from touchpoint to touchpoint.
Customers may be asked to repeat themselves as they switch channels or have a varied experience depending on whether they call or email a brand, for instance.
This can be off-putting and cause customers to question a company’s value alignment and coherence, which leads to mistrust.
Solution: Mapping the customer journey and identifying critical touchpoints that truly influence the customer experience can help companies create a seamless brand experience across all platforms.
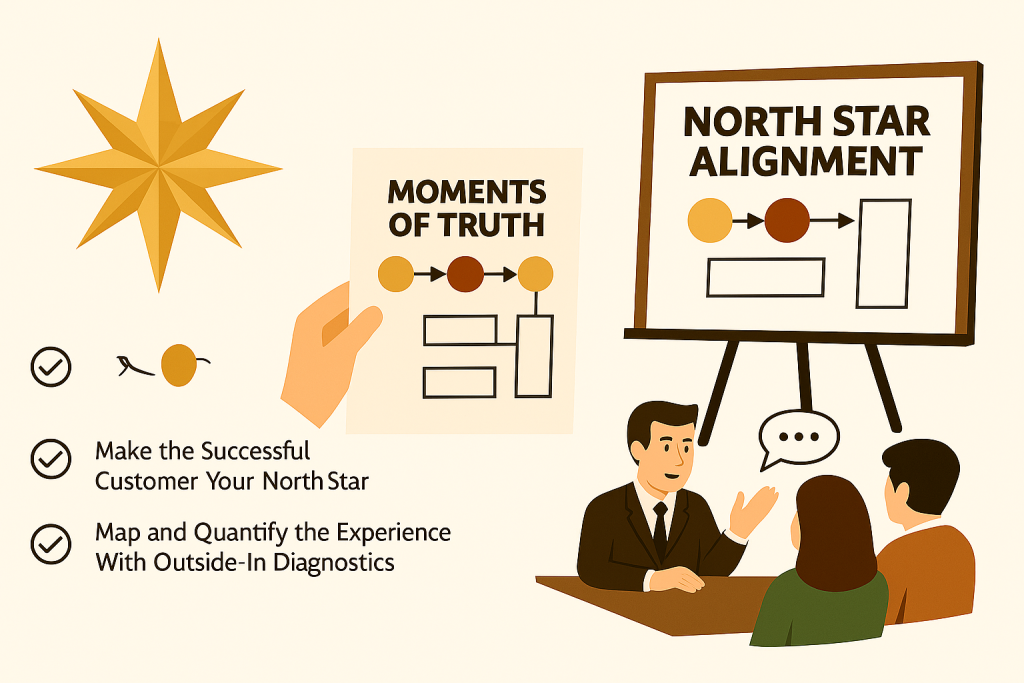
This means ensuring that each Moment of Truth (all interactions) between the customer and the company upholds its values, messaging, etc. Breakdown silos between functions by clarifying stakeholder’s roles/responsibilities around CX & customer journey.
Invest in internal collaboration platforms that help unify & empower cross-functional teams.
3. Poor personalisation
✅ How should we approach this challenge?
Leverage analytics & orchestration platforms that allow you to easily deploy data-backed recommendations
Customers are not the same, their journeys shouldn’t be either.
Each journey you design should be informed by their needs (even if the customer doesn’t know them), history, preferences, context, and behaviour.
They expect brands to remember them & tailor journeys according to their past interactions, otherwise, it makes them feel like they’re just another number & that you’re trying to sell them something.
This is where personalisation comes into play; it’s about crafting journeys that are relevant & valuable to the customer.
This involves segmenting your customers & creating personas to better target them.
Solution: To create better & more personalised customer journeys, invest in Outside-In CX techniques and tools that can make this possible for you.
Use analytics platforms that provide recommendations based on customer information or segmentation, and are contextually aware of the customer as they’re on their journey.
These platforms often contain pre-built CX orchestration frameworks you can leverage to coordinate touchpoints and deploy personalisation tactics.
4. Friction in navigation & processes
✅ How should we approach this challenge?
Focus on optimising the customer journey by streamlining & simplifying CX & removing Moments of Truth that are not necessary
Friction points or pain points in a customer journey are barriers that customers face that could make them abandon a journey, or cause extra hassle for the customer when it comes to progressing along said journey.
This could be long & confusing checkout processes, cumbersome navigation on a company’s website or app, unclear product descriptions or directions, or slow response times to customer support inquiries.
Solution: First, you should map the customer experience so that you can identify these friction points.
Then, through testing you can improve upon or resolve them.
This may involve reducing the number of Moments of Truth it takes to complete a purchase or sign up for a service.
Sometimes there’s a straightforward fix (remove a page or step that’s unnecessary or make the webpages load faster).
Or there are other fixes (for instance, make customer support respond faster), and so on.
Just always bear in mind that a customer experience should be as lean as possible!
5. Weak & inconsistent measurement of outcomes
✅ How to solve this problem?
Have a well-defined set of CX metrics, consistently measured, and correlated to business results.
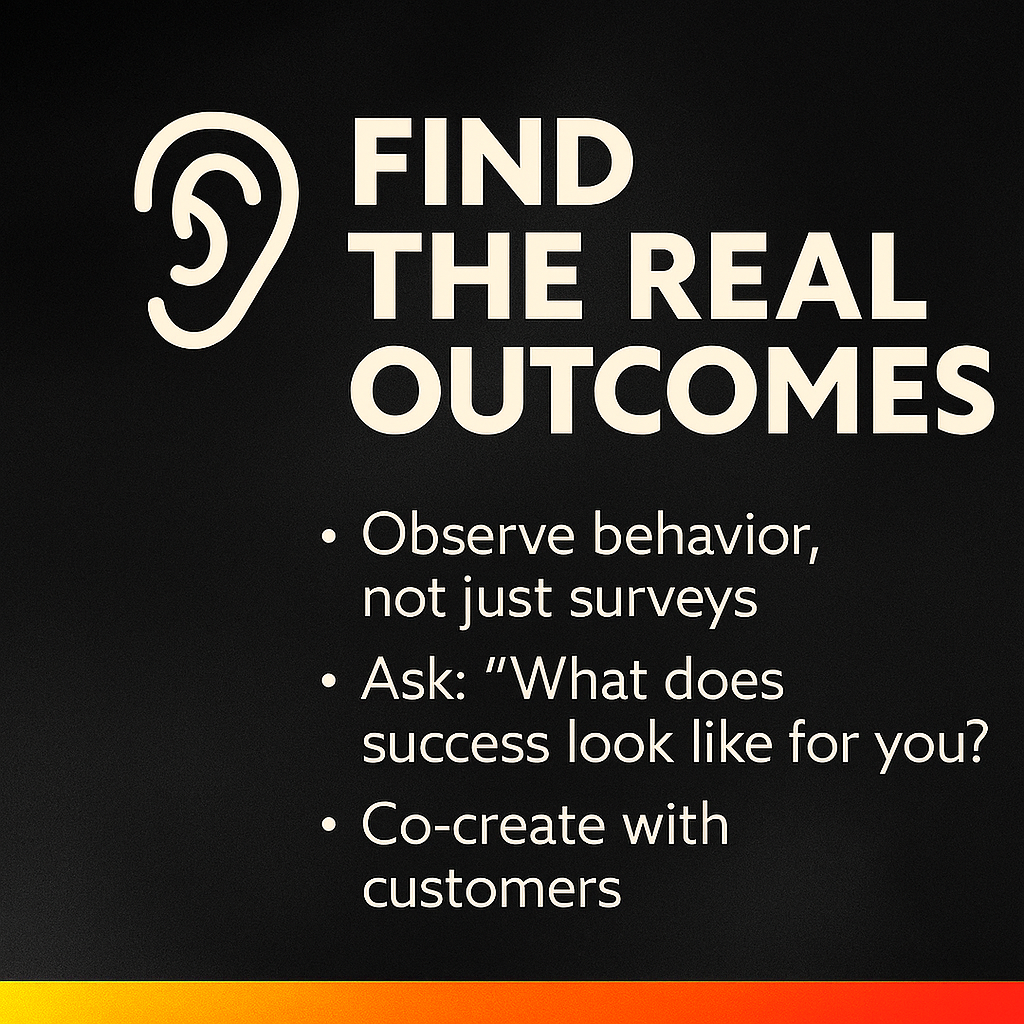
Weakness or absence of a consistent method of measuring customer experience outcomes and tying them to business impact is one of the most common mistakes in journey management. Many companies measure vanity metrics or service operation KPIs but do not measure if the journey is creating value for the customer. Without regular and consistent measurement, it is impossible to gauge whether the improvements are effective or whether CX investments are worth it.
The lack of consistency also results in the different parts of the business reporting different things and not having a consistent idea of what “success” looks like. This results in businesses being unable to optimise journeys, reduce friction, and build loyalty.
Solution: Have a set of core CX metrics (customer satisfaction, NPS, retention, loyalty, engagement, Outside-In Dashboard elements), which is measured in every journey consistently. CX outcomes should wherever possible be correlated with business performance (the Triple Crown of revenue, cost, and service). Use customer journey analytics platforms to measure consistently across all Moments of Truth and Handovers so that it is possible to compare and contrast to create an actionable insight. The use of insights to refine journeys is an iterative process and the only way to build journeys and prove CX impact.
✅ Conclusion
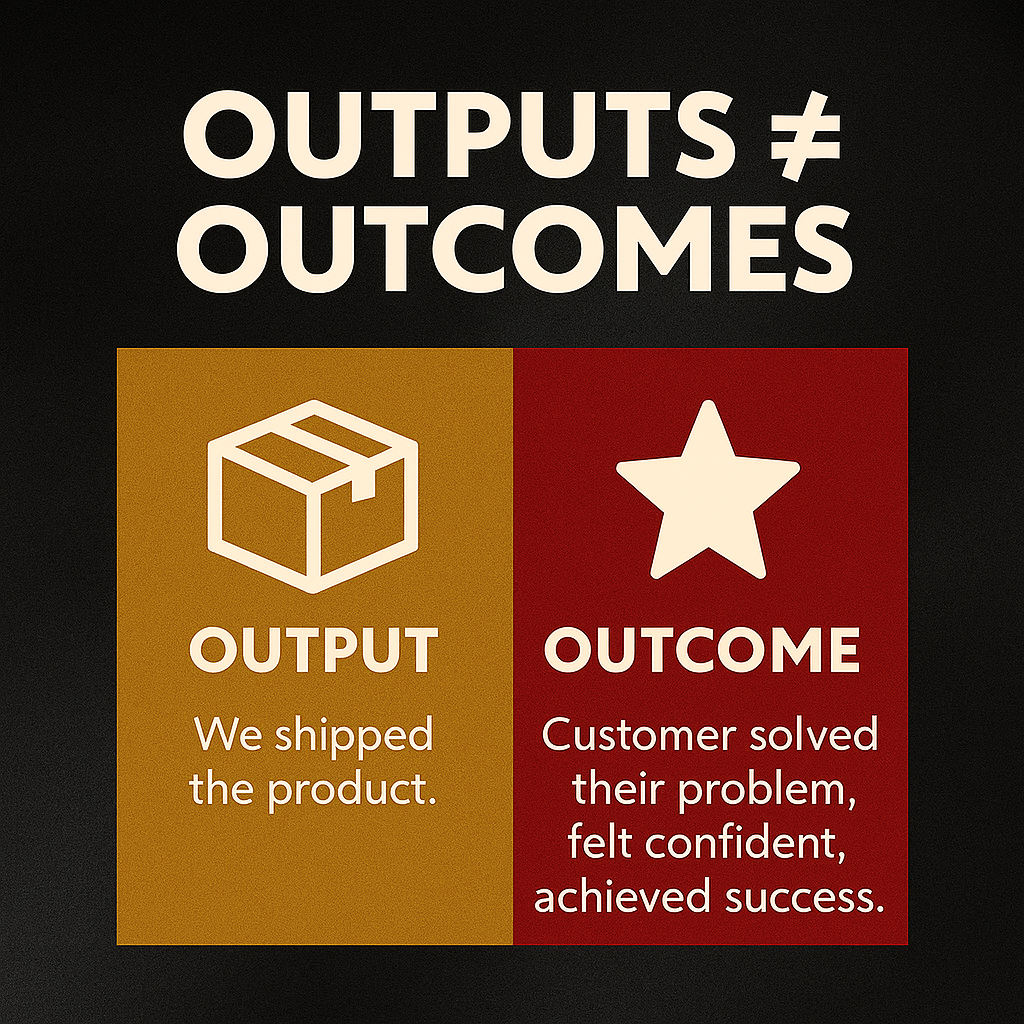
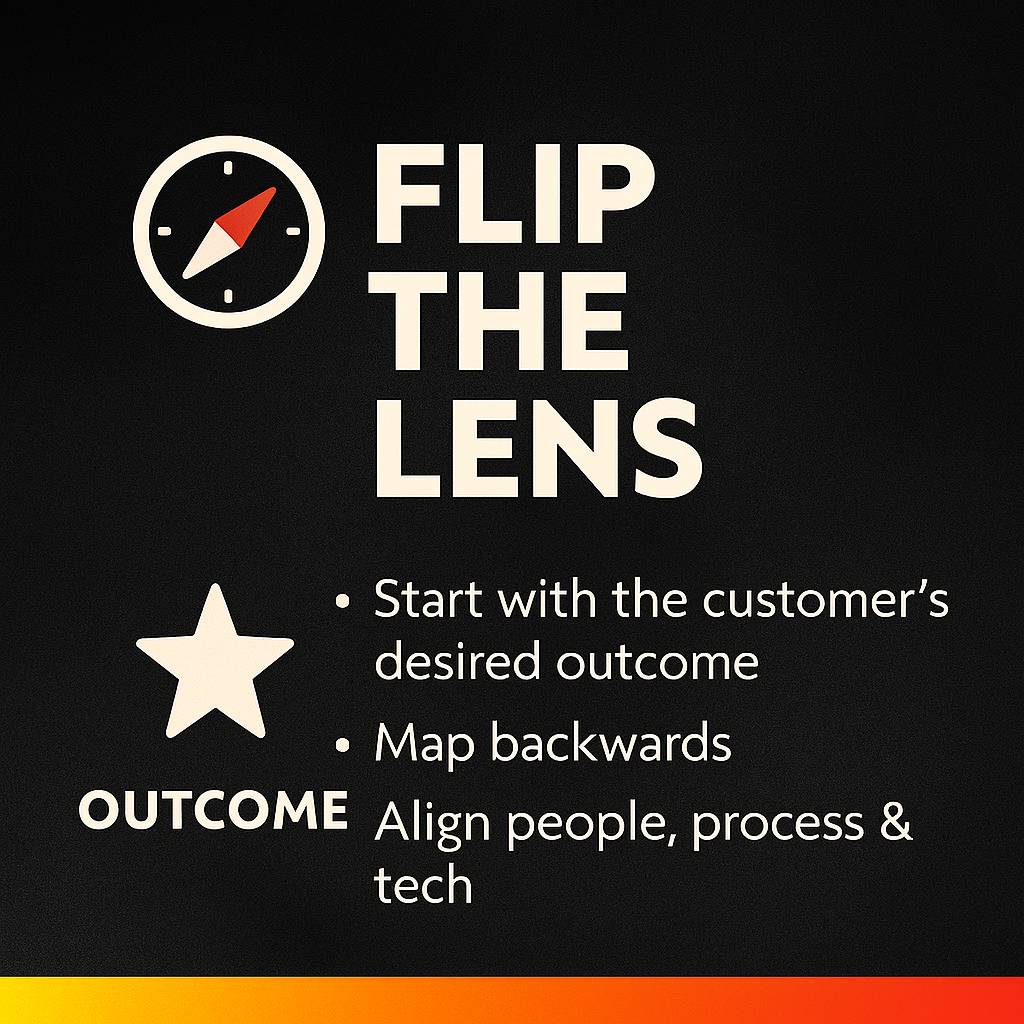
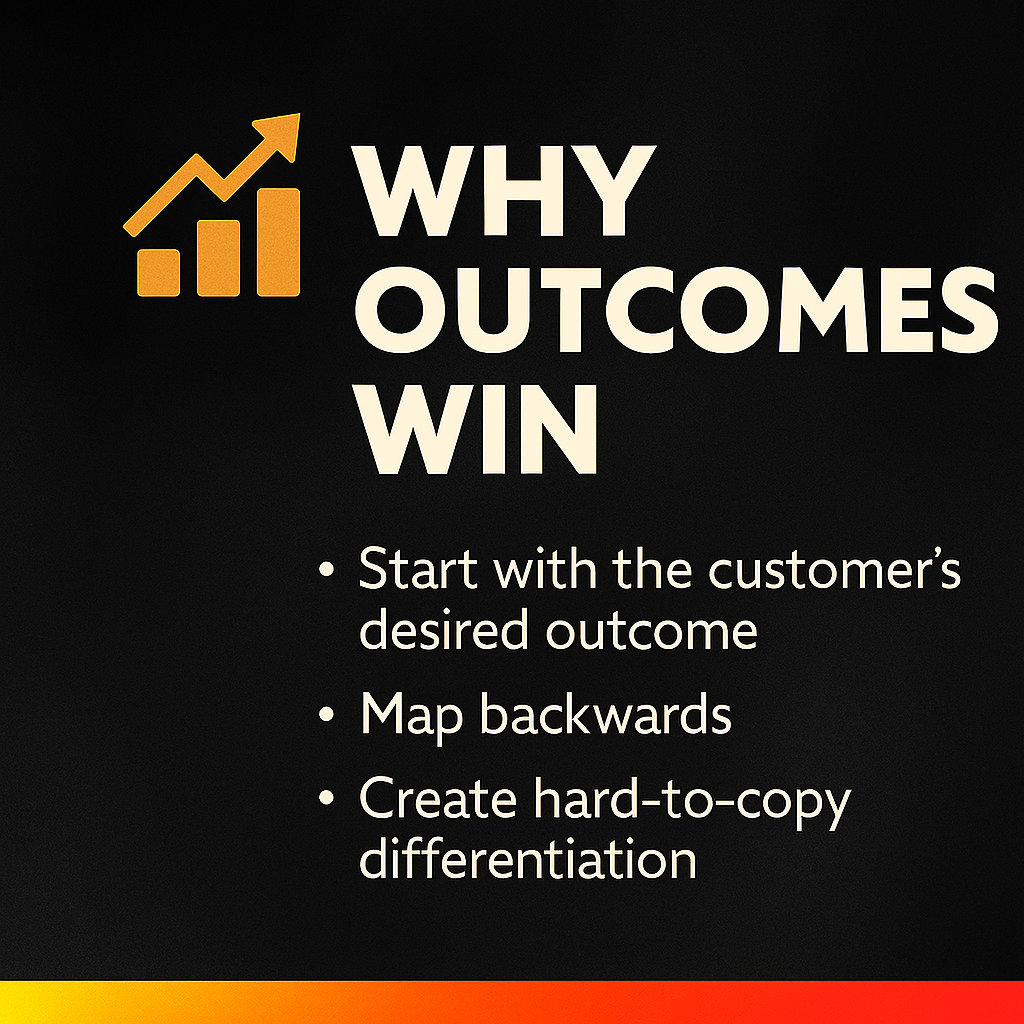
Customer journey management is only as good as how well the desired outcomes are defined and measured. All five challenges – lack of customer data & insights, journey touchpoints are in silos, poor personalisation, friction in navigation, and weak measurement – present an obstacle in the way of a smooth Outside-In experience.
The solutions are:
Have a unified CX measurement framework (such as the Outside-In Dashboard) that measures loyalty, engagement, retention, NPS, satisfaction, Moments of Truth and other outcome metrics.
Correlate CX outcomes with business performance (the Triple Crown: revenue, cost, and service) to demonstrate quantifiable impact.
Act on the insights to improve and refine journeys. Break silos, eliminate friction points.
Use analytics and orchestration platforms to personalise and create consistency across all touchpoints.
Customer journey management is not a one-time project but a discipline of continuous measurement and improvement. The customer journey life cycle is only complete when every stage of the journey is measured in the context of defined CX outcomes. Embedding outcomes into the process of journey management will help ensure CX investments contribute to business growth.
What do you think? 👇
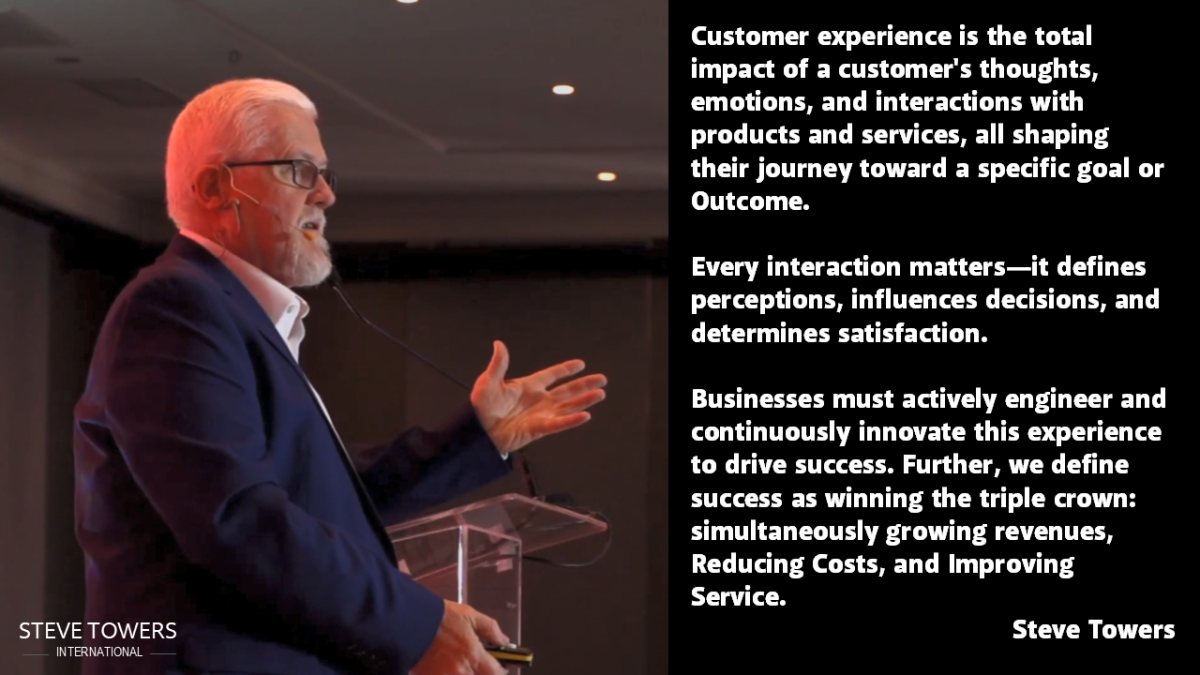
Businesses must actively engineer and continuously innovate this experience to drive success. Further, we define success as winning the triple crown: simultaneously growing revenues, Reducing Costs, and Improving Service.

Steve has also published many articles and conference keynotes (see the MOT primer below) reviewing the continued evolution of this fascinating concept.
Join us at a coaching session and become qualified in Customer Centric and Process Transformation https://www.bpgroup.org or visit https://www.stevetowers.com
Definitions
What is a Moment of Truth?
A Moment of Truth is any interaction with the customer within the Customer Experience, first discussed in my 1993 book ‘Business Process Reengineering – A Senior Executive’s Guide‘
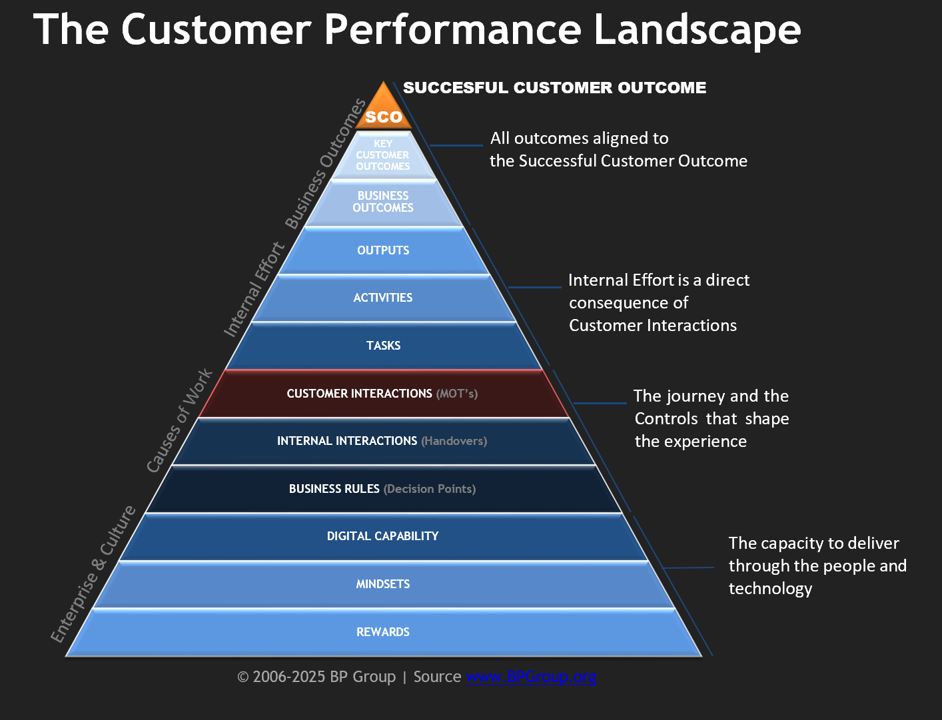
Moments of Truth are the cause of all work.
This understanding underpins the CEMMethod, first launched in 2006 and now in version 15. It is the idea that all work an organisation undertakes is, at a fundamental level, caused by Moments of Truth. In principle, everything a company does can and should be linked to a Moment of Truth.
Managing Moments of Truth
Enlightened ‘Outside-In’ organisations actively embrace Moment of Truth Management as an essential strategic and operational necessity to deliver engineered Customer Experiences. How so?
a. Designing for Moments of Truth – The Design-Implementation Gap
Early efforts were geared towards designing optimal Moments of Truth; however, simply mapping customer journeys has never been enough. It is one thing to agree on what a future state customer journey should be; it is entirely another to implement it. This Design-Implementation gap is precisely what kills the majority of Customer Experience initiatives.
b. Implementing optimised Moments of Truth
Successful deployment of innovated Moments of Truth is key to delivering optimal Customer Experiences. The most practical immediate results focus on a rapid rollout across a key experience, using the success of that rollout to validate the smooth rollout across the organisation. Establishing ownership, accountability, metrics, controls and improvement paths are part of this discipline.
c. Operationalising Moments of Truth
Once Moments of Truth have been designed, innovated and implemented into recrafted customer experiences, they need to be actively managed ‘in the moment’ and shared. Every Moment of Truth should feed to a corporate dashboard, with real-time data showing the performance of that MOT and its associated experiences. If things go wrong, the owner should be able to ‘course correct’ and real-time monitor the customer experience delivery.
Imagine a world without customer satisfaction surveys, no need for Net Promoter Scores, no focus groups, and no mystery shopping because you will know how 100% of interactions are performing 100% of the time.
Control and Action combined
The C-suite and leaders will now have a clear line of sight into every corner of the organisation and across the enterprise landscape, in real-time. One version of the data truth (and not all those departmental/divisional versions of reality).
The need for retrospective action evaporates. Immediate and laser-focused control can be maintained, delivering simultaneously enhanced service, lower costs, higher revenues, improved compliance and uber motivated employees.
MOT primer…
Steve Towers
https://www.linkedin.com/in/stevetowers/
Richard Normann – creator of the Moments of Truth concept:
https://en.wikipedia.org/wiki/Richard_Normann
Jan Carlzon – author of ‘Moments of Truth’
https://en.wikipedia.org/wiki/Jan_Carlzon
Moments of Truth 2025 (VIDEO)
https://youtu.be/3mzz_LdgmFY
That Kodak Moment of Truth
https://www.processexcellencenetwork.com/innovation/columns/4-lessons-from-the-kodak-moment-of-truth
Mitch Belsley – Get Scientific about Managing Moments of Truth
http://customerthink.com/get-scientific-about-managing-moments-of-truth/
Accreditation & Certification in CX and Process
https://www.bpgroup.org

